
Simplified: Voter turnout in Tuesday's election was the lowest it's been since at least the mid '90s. Sioux Falls Simplified took a deep dive into the data to see what we can learn and how turnout varied throughout town.
Why it matters
- Voter turnout varied widely from precinct to precinct. A couple of precincts saw turnout as low as 4 percent, ranging all the way to 42 percent for the two most active precincts.
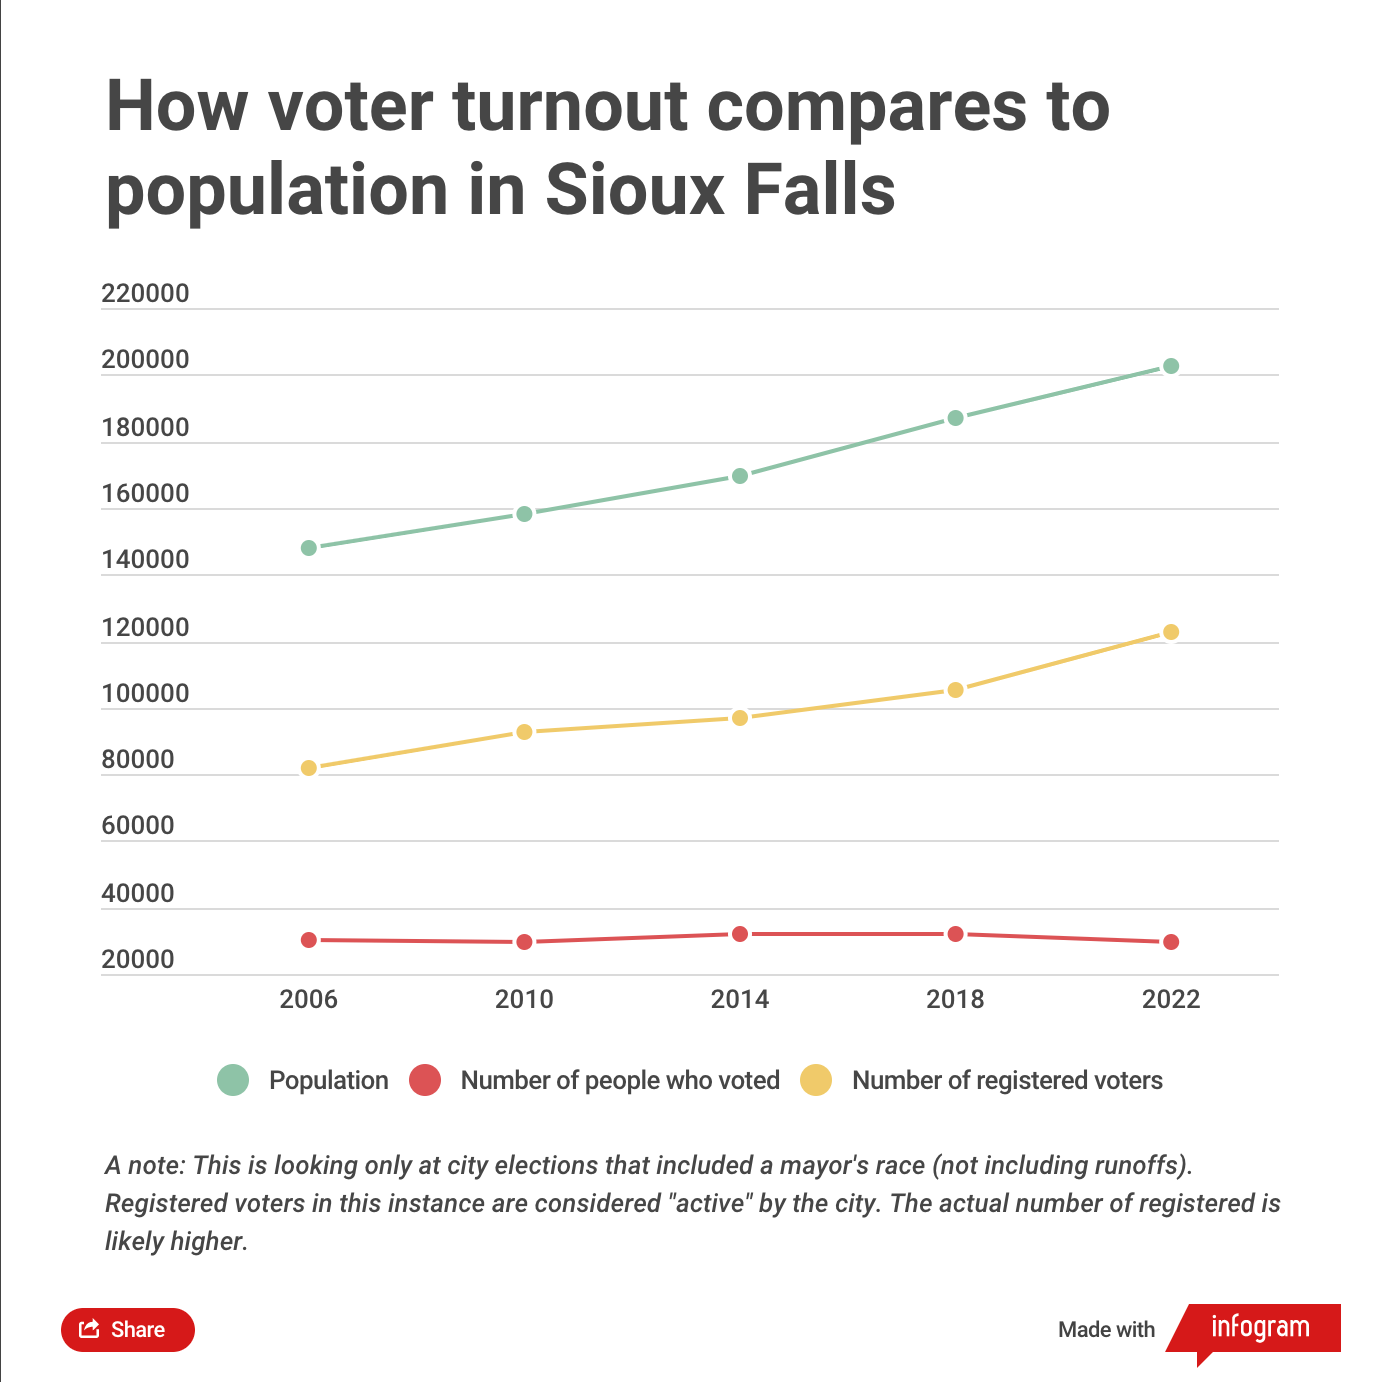
- Though Sioux Falls has grown, the number of voters has not kept pace with population growth. (See graph below.)
- That means that as the city grows, the number of people making decisions on its elected leaders has stayed about the same, according to Sioux Falls Simplified analysis of city election data over the last five mayoral races.
- Looking closer at turnout data allows us to form hypotheses and ask further questions about why people in some areas are voting more and – perhaps more importantly – what reasons or barriers might be causing some people to vote less.
"I’m looking at the voter turnout, and it is a very difficult thing to really wrap your arms around to figure out why we have the trends that we do," City Clerk Tom Greco said.
Here are some observations from this week's election data
Some sides of town turned out more than others.
- Voters in Sioux Falls' southeast district had the highest turnout (about 32 percent), and voters in the northeast district had the lowest turnout (about 20 percent).
Turnout data showed some correlation to income (note: correlation does not equal causation). The two precincts with the fewest voters casting a ballot were also in neighborhoods with high rates of poverty.
- One of these precincts was number 05-15, a central district precinct with a curved border arcing from around 14th Street and Cliff Avenue, following the river until just south of Falls Park and then tracing the railroad tracks back to Cliff Avenue.
- The other precinct with 4 percent turnout – number 04-05 – was in the northeast district, covering a swath of land between Minnesota Avenue and I-229 north of Maple Street.
The two precincts with the highest turnout were in areas that generally have higher home values, which correlates with higher incomes in those areas:
- Precinct 05-19, a precinct on the west side of the central district covering a rectangle-shaped area between 26th and 37th Streets and Elmwood and Kiwanis Avenues.
- Precinct 02-02, a southeast district precinct that runs between 26th and 49th Streets with a western border running along the river up to Cliff Avenue and an eastern border tracing along Southeastern Avenue and over to Bahnson Avenue. It includes Tuthill and Pasley Parks.
See the increasing gap between voters and the greater population
This graph takes a closer look at the voter turnout over the last five mayoral races.
- It does not include runoff elections.
- The voter turnout is also compared to the number of active registered voters, per city data, as well as the city's recorded population estimate for each year.
What are we to do with this information?
That's entirely up to you.
As with any data set, the conclusions will come from what questions are asked.
For Greco, voter turnout data helps inform how many ballots are sent to precincts in future elections. It might also illustrate the need to adjust polling locations, for example.
For Michelle Erpenbach, a former city councilor and current nonprofit director, the data shows a need to ask more questions about the reasons why people are not voting and taking a more intentional look at the systems that might be keeping them away.
"What we have to do is figure out as a society that it's OK for everyone to vote," Erpenbach said, "and then make it as easy as possible."